


In this post I want to show you how I created the main panel of this dashboard with Storyblok and ApexCharts.
Prerequisites
As this post is the continuation of a series, if you haven't read it yet you should start with the Part 1.
Do you have everything up to date? So let's get on with it.
Defining the main panel
As the dashboard consists of three main KPIs such as weight loss, minutes active and steps, we will represent these data through blocks and charts.
We can divide the dashboard into three parts:
Main block (Activity)
This block will be the first one we will see on the dashboard. It should be as wide as possible and show data from the last two weeks, compared to the previous month.
For this example, we will focus only on the steps and, at the moment, we will use test data generated by Math.random().
Create objective
In order to make sense of the results shown in the dashboard we need a block from which we can choose our objectives.
Today results
And clearly, we need a section where we can see at a glance how we're doing today.
Create the main panel structure
After having a general idea of how our first version will be, let's shape it up!
1. Chart Block
The first thing we are going to do is to define a component that will allow us to define the title, size and aspect of each block.
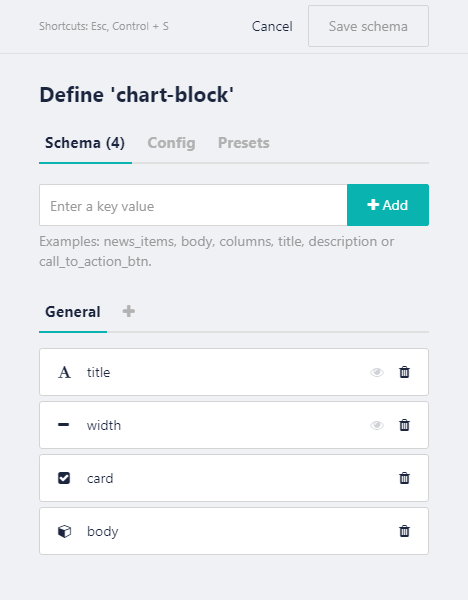
For that, we go to the Storyblok panel and in the Components section we create a new one. In its schema I have defined the fields I show you below:
- Title, type text field.
- Width, a single-option selector with three options 'full', 'one third' and 'two third'.
- Card, a boolean that if checked the vue component will add TailwindCSS styles to simulate a card.
- Body, type block to add the content we want in each section.
The resultant schema will be:
After defining it, I have created its equivalent vue component named ChartBlock.vue, then I’ve added it in the plugin components.js with the rest of components:
/* Dashboard */
import ChartBlock from '@/components/ChartBlock.vue'

Vue.component('ChartBlock', ChartBlock)
In this component we receive, in the prop blok, all the information defined in our schema.
- blok.width: As the width is given by the values 'full', 'one-third', 'two-third', I have created an array in data that will return the equivalent tailwind class to the chosen width.
- blok.title: The title will simply be represented between h2 tags. Depending on the width chosen its font size will be smaller, for example for the case 'x-third' its font size will be the one defined by the class 'text-xl'.
- blok.card: In this case (a boolean), if its value is true we will represent the classes 'bg-white rounded-lg p-4 md:p-6', which will give it a card shape, and if not simply 'md:pl-8'.
- blok.body: As always, we will add it in a dynamic component that will represent the blocks we add from Storyblok in the body field.
<template>
  <div class="pt-6" :class="width[blok.width]">
    <section
      class="w-full"
      :class="blok.card ? 'bg-white rounded-lg p-4 md:p-6' : 'md:pl-8'"
    >
      <header class="pb-4">
        <h2 :class="{ 'text-xl': blok.width !== 'full' }">
          {{ blok.title }}
        </h2>
      </header>
      <div :class="{ 'flex flex-wrap md:-mr-6': !blok.card }">
        <component
          :is="blok.component"
          v-for="blok in blok.body"
          :key="blok._uid"
          :blok="blok"
        ></component>
      </div>
    </section>
  </div>
</template>

<script>
export default {
  props: ['blok'],
  data: () => {
    return {
      width: {
        full: 'w-full',
        'one-third': 'w-full md:w-1/3',
        'two-third': 'w-full md:w-2/3'
      }
    }
  }
}
</script>
2. Chart Activity
This will be the component that represents our main chart, created through VueApexCharts, that I’ll tell you about below.
Just as we defined the style guide components, we create ChartActivity in Components in the Storyblok panel without a schema. And now, we create ChartActivity.vue and add it to the components.js plugin as with ChartBlock:
/* Dashboard */
import ChartActivity from '@/components/ChartActivity.vue'

Vue.component('ChartActivity', ChartActivity)
For this component, as we want to use ApexCharts for our charts and we’re working with VueJS, we’ll also need to add to our project the wrapper they have prepared for us.
We are going to install the dependencies using the following commands:
npm install --save apexcharts
npm install --save vue-apexcharts
Now, to start using it in our Nuxt.js project we're going to create a plugin called vue-apex-charts.js in the plugins folder with the content:
import Vue from 'vue'
import VueApexCharts from 'vue-apexcharts'

Vue.use(VueApexCharts)
Vue.component('VueApexCharts', VueApexCharts)
And, in our nuxt configuration file, we're going to add it with client mode enabled (necessary for it to work):
plugins: [
  …,
  { src: '~/plugins/vue-apex-charts.js', mode: 'client' }
],
Surrounding by the client-only tags the VueApexCharts component, we can now use it in our ChartActivity component 🍾 Let’s see it:
<template>
  <client-only>
    <VueApexCharts
      height="350"
      type="bar"
      :options="chartOptions"
      :series="series"
    />
  </client-only>
</template>
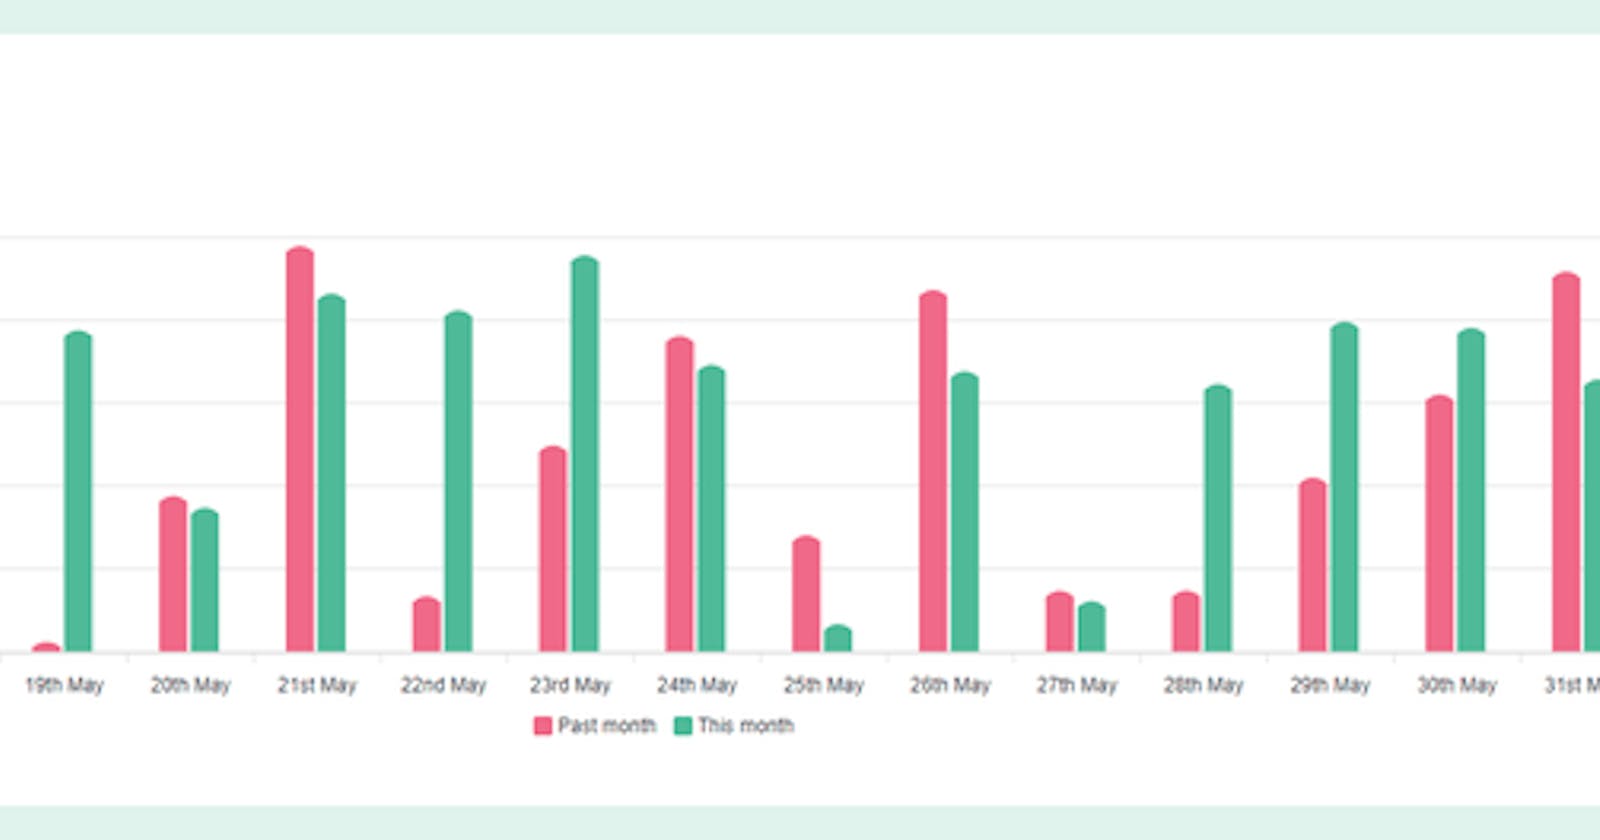
All the options available to bring our charts to life can be found at ApexCharts docs, I recommend you keep an eye on it.
This is how the test chart looks like, with a type bar chart and our main colors:

3. Chart Objective
As above, I've created a new one component named ChartObjective without a schema. And I've created the component ChartObjective.vue, as before, adding it to the components.js:
/* Dashboard */
import ChartObjective from '@/components/ChartObjective.vue'

Vue.component('ChartObjective', ChartObjective)
As we are not yet going to add the post request that would go in this block, for now I have simply added an SVG illustration representing the action to be performed.
4. Chart Result
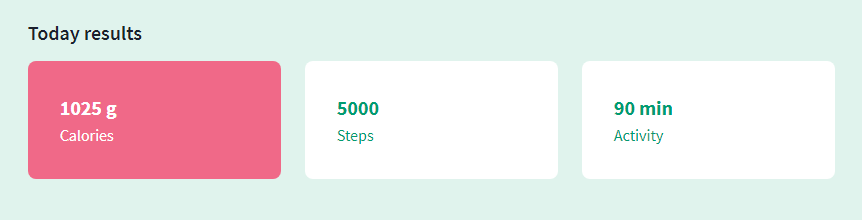
In this block we will represent the highlights of the day, the weight lost, the steps taken and the minutes of activity.
For that, as in the previous cases, we created the component both in Storyblok and in our project. In this case we will have three fields: name, value and highlighted.
That's how we represent it:
<template>
  <div class="w-full md:w-1/3 md:pr-6 pb-4">
    <div
      class="rounded-lg p-8"
      :class="{
        'bg-complementary-300 text-white': blok.highlighted,
        'bg-white text-primary-500': !blok.highlighted
      }"
    >
      <strong class="text-xl">{{ blok.value }}</strong>
      <p>{{ blok.name }}</p>
    </div>
  </div>
</template>

<script>
export default {
  props: ['blok']
}
</script>
And that's how it would look:
Main page composition
Now that we have created all the components we need to create our main page, we just need to add them in the Cabbage page, already created in the last article.
Our body will be composed by three ChartBlocks:
- Main activity: with 'Main activity' as title, true card, full width and ChartActivity as the only block on body.
- Create objective: with 'Create objective' as title, true card, one third width and ChartObjective as the only block on body.
- Today results: with 'Today results' as title, false card, two third width and three ChartResult blocks on body.
The resultant body page looks like now:

Great! I've finished telling you the progress on the dashboard 💜
This is how our main panel looks like:

I've updated the project in Cabbage Dashboard DEMO 💜
And remember, I will be adding new functionalities and explaining how I did it 🥰
Here is the repository, in case you want to take a look: https://github.com/Dawntraoz/cabbage